Written by John McFarland of the Oil and Gas Lawyer Blog.
Here’s a great interactive graphic from Bloomberg, “Watch Five Years of Oil Drilling Collapse in Seconds,” that illustrates the relationship between oil price, rig count and U.S. oil production. The U.S. rig count has dropped from a high of 1930 in late 2014 to 502 last month. U.S. crude production continued to climb until mid-2015. Since then, it has dropped from 9.6 mmb/day to 9.2 mmb/day.
RigData provides another way to look at the market, in Texas (click to enlarge):
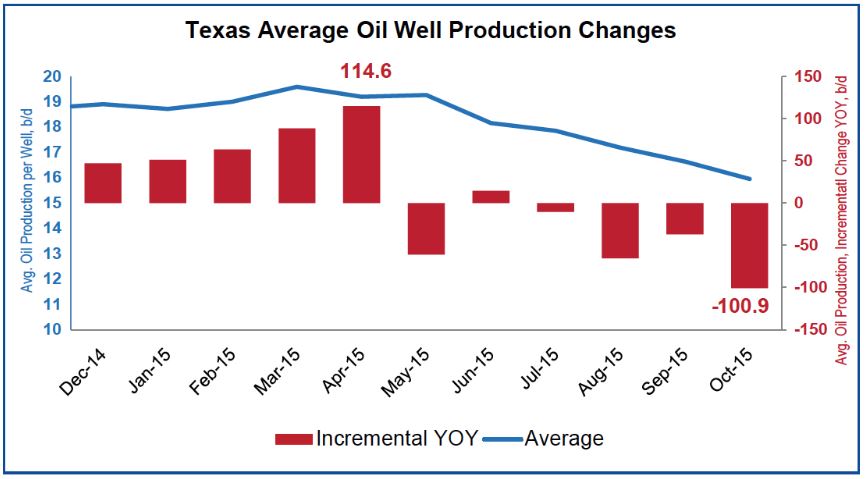
It may come as a surprise to some that the average daily oil production per well in Texas is only 16 barrels. There are a lot of wells in Texas that produce a barrel a day or less. The change in average daily oil production per well is a way to gauge the health of the industry. In Mary 2015, Texas average production per well reached a height of 19.6 bbl/day. Between October 2014 and October 2015, Texas oil production declined by 343,00 bbl/day, from 3.3 million to 2.9 million – a decline of 2.2 bbl/day/well.
The decline in production is of course a result of the decline in oil prices. But it may not be so obvious that the decline in production results not only from the resulting decline in drilling of new wells, but also from the decline in production from low-producing “stripper” wells. Wells that produce a barrel a day or less may not be economical to produce at $30/bbl. After payment of operating costs, royalties and severance taxes, costs may exceed revenues for such wells, and they may be shut in or plugged.
As stripper wells are shut in or plugged, they reduce the number of producing wells, thereby increasing the average production per well in Texas, since the stripper wells produce less than the average bbls per day.